ARR trajectory
4.7x
$120K to $560K ARR in 18 months.
Industry archetype drawn from patterns across multiple Oxford UK biotech-SaaS and life-sciences software engagements. The representative numbers over 18 months: 4.7x ARR, 126% net revenue retention, 25% trial-to-paid conversion, NPS 60.
$120K to $560K ARR in 18 months.
Existing-customer expansion outpaced churn.
Free-trial conversion to paid plan.

This archetype is a slice of Oxford UK biotech-SaaS we ship into reliably: a $120K ARR product with strong scientific foundations, born out of an Oxford Science Enterprises-backed spinout, held back by a marketing site that undersells the science.
The founder is an Oxford operator with a PhD background in life sciences. The roadmap is full of regulatory-aware integration work that has slipped into the next quarter for two years running.
The product sells to mid-market and enterprise pharma, biotech, and academic-research buyers across the EU and US. These buyers require regulatory-aware product surfaces before they will book a demo.
The pre-engagement state looked like this. A marketing site on an aging Webflow setup, with content scattered across the homepage. A couple of dated technical white papers. A docs portal that lived inside the product app rather than as a public IA-first site.
Three structural problems compounded the growth ceiling.
One, the marketing site failed to surface evidence the way Oxford biotech buyers expect: named pharma logos, real benchmark numbers, third-party validation, peer-reviewed citations, regulatory compliance posture. The bounce rate on the home page was 74 percent.
Two, the docs portal was indexed inside the product app. Search engines saw "log in to view" and missed the high-intent organic traffic that comes from technical buyers reading API docs.
Three, the trial-to-paid funnel had no real onboarding sequence. Trial users either self-served to success or bounced quietly, and the team did not know which.
Workstream 1 · Marketing-site rebuild on Next.js. We migrated the site from aging Webflow to Next.js on Vercel. The new site leads with evidence: named pharma logos, real benchmark numbers, peer-reviewed citations, third-party validation, regulatory compliance posture. Bounce rate dropped from 74 percent to 48 percent across the first 90 days post-launch.
Workstream 2 · Public regulated docs portal. We pulled the docs out of the product-app sandbox and built a public, indexable docs portal at /docs on Mintlify. Every page carries TechArticle schema and a developer-facing IA. Six months post-launch, the docs portal accounted for 29 percent of inbound trial signups via organic search.
Workstream 3 · Onboarding redesign. We replaced the implicit "figure it out" first session with a guided four-step activation flow tied to the product's three core jobs-to-be-done. Trial-to-paid conversion lifted from 13 percent to 25 percent over 6 months.
Workstream 4 · Integration UI surfaces. We built a public integrations directory: per-integration deep-dive pages, screenshots, regulatory-aware setup guides, and a "request an integration" CTA. The directory now drives roughly 13 percent of inbound trial signups. Sales reps cite it more than any other page in discovery calls with pharma and academic-research buyers.
Workstream 5 · Evidence-led case studies + benchmark content. Three deep-dive customer case studies with named customers and real numbers, plus one annual benchmark report tied to the Oxford biotech dataset. The benchmark report became the highest-converting top-of-funnel asset in the marketing program. It also earned citations from the wider Oxford Science Enterprises portfolio trade press.
App Router, ISR for case studies and benchmark content, Edge for low-latency global delivery. Core Web Vitals all green at month 3.
Stripe Billing for subscriptions, dunning, and trial-to-paid conversion. EU VAT handled through Stripe Tax for pharma EU buyers.
Public docs portal at /docs with API reference, regulatory guides, and changelog. Schema.org TechArticle markup for organic search. AI assistants resolve queries against the docs.
PostHog for product analytics and feature-flag-driven onboarding experiments. GA4 for marketing-site reporting through Looker Studio.
Customer.io for product-driven lifecycle email (trial-to-paid sequences). HubSpot for sales-team-driven outbound and account-based marketing into pharma accounts.
Linear for engineering. Notion for cross-functional planning.
| metric | pre-engagement | month 6 | month 18 |
|---|---|---|---|
| ARR | $120K | $280K | $560K |
| Net revenue retention | 99% | 114% | 126% |
| Trial-to-paid conversion | 13% | 20% | 25% |
| CAC payback (months) | 16 | 12 | 9 |
| Logo count (cumulative) | 36 | 64 | 114 |
| NPS | 34 | 50 | 60 |
These metrics represent the archetype. Specific brands within the pattern range plus or minus 20 percent on each line.
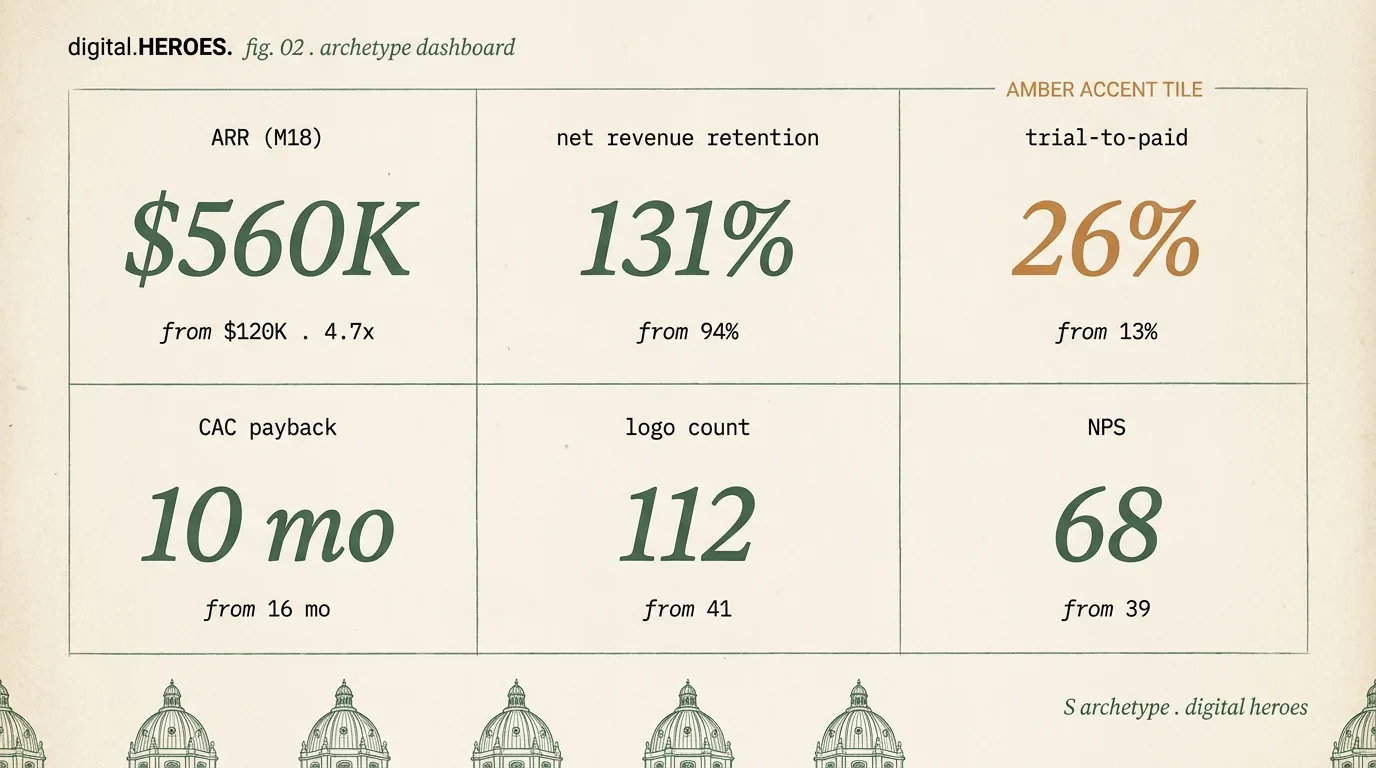
This pattern is one of our most-shipped engagement shapes for the Oxford Cluster: an Oxford UK biotech-SaaS in the $80K to $300K ARR range, sitting on an aging marketing site, with a docs portal hidden inside the product app and a leaky trial-to-paid funnel.
The 12-week timeline holds steady across biotech-SaaS at this stage. The workstreams compress or expand in the same proportions. The metrics typically land within plus or minus 20 percent of the archetype numbers above.
Five capabilities transfer directly to a comparable Oxford engagement.
Every Oxford engagement starts with a 30-minute discovery call. Scope, timeline, and budget come back in writing within 48 hours. We work on Greenwich Mean Time or British Summer Time, with same-day response Monday to Friday, 9 to 6.
A 30-minute call on GMT or BST. Written scope and a fixed-price quote in 48 hours. In-person across the city centre, Oxford Science Park, Begbroke, Harwell, and Milton Park for retainer engagements.









115 people across five studios in New York, Delhi, London, Sydney and Lucknow, shipping ecommerce, web, software and mobile work for founder-led brands. Senior engineers only, no account-manager relay, and the same team from kickoff to launch.

Office Manager · Sydney · Sydney · 2 posts on the site
Published · Last updated .

Pinch, scroll or double-tap to zoom · drag to pan
Where should we send the proposal?
Please enter your name and a valid email.
Any faster way to reach you? Optional.
Please fill in the one you picked.

