Your Glendale studio has ShotGrid, QuickBooks, and a payroll export that never meet in one number
Custom business intelligence work for a Glendale business runs $40k to $130k over 2 to 6 months. Often the answer is not a custom dashboard but a data layer underneath one.
On this page
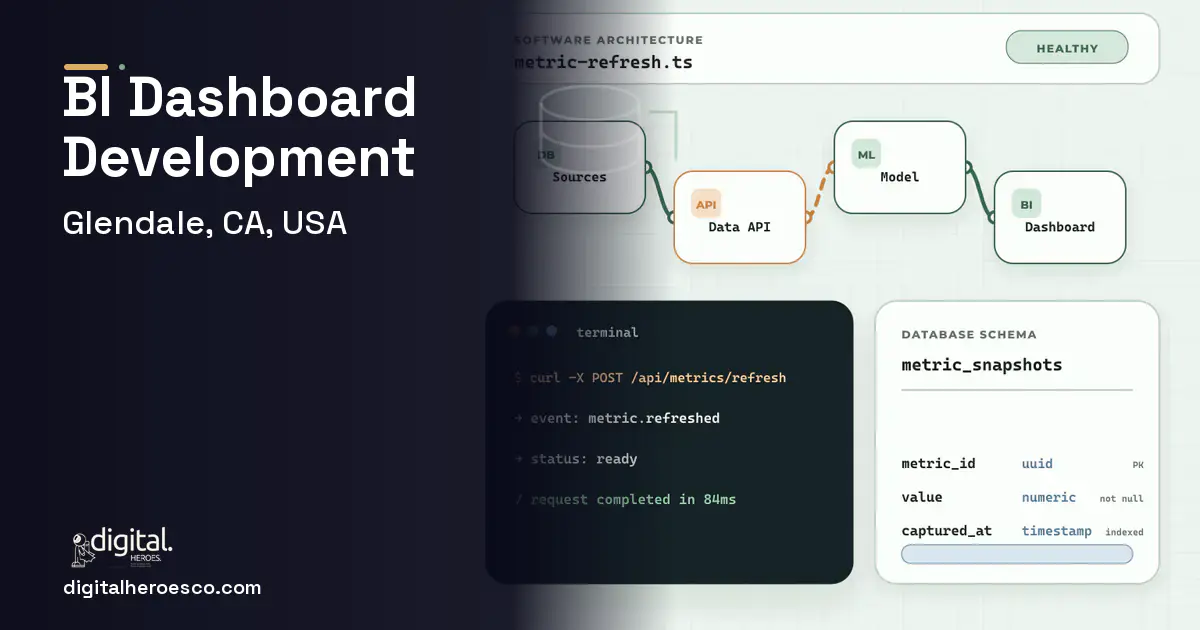
Custom business intelligence work for a Glendale business runs $40k to $130k over 2 to 6 months. Often the answer is not a custom dashboard but a data layer underneath one. Tableau, Power BI, and Looker are excellent at visualizing data, and useless when the data lives in five disconnected tools, which is exactly the Glendale studio's reality: production in ShotGrid, money in QuickBooks, labor in payroll, all separate.
Tableau, Power BI, and Looker assume you have a clean, unified dataset to point them at. Most Glendale studios do not. Production state lives in ShotGrid, revenue and cost in QuickBooks, labor in a payroll system, freelancer spend in accounting, and client data in a CRM (Customer Relationship Management), none of which share keys or definitions. A dashboard built on top of that disconnect just visualizes one silo prettily while the cross-cutting questions, is this show profitable, what is our real utilization, stay unanswerable.
The gap shows up when leadership asks a simple question and gets a week of analyst work. What is our margin by client, across all active shows, accounting for freelancer cost? Nobody can answer without pulling exports from five systems and reconciling them by hand in Excel, which means the answer arrives late, stale, and contested. The BI tool was never the problem; the missing data layer that joins production, finance, and labor into one trustworthy model was.
The problems nobody warns you about
- Data lives in ShotGrid, QuickBooks, payroll, and a CRM that share no keys, so a dashboard only ever shows one silo
- Cross-cutting questions, margin by client, real utilization, need five exports reconciled by hand in Excel
- Definitions differ across tools, so two reports disagree and leadership trusts neither
- Answers arrive late and stale because there is no unified data layer feeding the BI tool
The case for owning your business intelligence dashboards
You build a custom data layer, often more than a custom dashboard, when your numbers live in disconnected tools that share no common model. A Glendale studio needs production, finance, and labor data joined into one trustworthy source with agreed definitions, so a dashboard can finally answer margin by client or real utilization without a week of analyst reconciliation. The visualization can even be Power BI on top; the build is the pipeline and data model underneath that makes the answers real and fast.
Budgeting a business intelligence dashboards build in Glendale
| Project scope | Typical cost | Timeline |
|---|---|---|
| Data pipeline + unified model + core dashboards MVP | $40k to $70k | 2 to 3 months |
| Margin and utilization models + automated refresh + quality checks | $70k to $100k | 3 to 5 months |
| Full BI platform + multi-source + custom dashboards + scale | $100k to $130k | 5 to 6 months |
What your build should include
Glendale business intelligence dashboards: the full scope
Everything a business intelligence dashboards build here can cover: data warehouse, embedded analytics, business intelligence dashboards, BI development, data visualization, Tableau alternative and Power BI.
Exactly what you get
A trustworthy data layer that joins production from ShotGrid, money from QuickBooks, and labor from payroll into one model with agreed definitions, plus dashboards on top that finally answer the questions leadership actually asks. Margin by client across active shows, real utilization, project profitability, all available on demand instead of after a week of an analyst reconciling exports in Excel. The numbers refresh automatically so they are current, and data-quality checks flag bad source data instead of quietly charting it as if it were true.
How to choose a developer in Glendale
Hire a partner who treats the data layer as the real work and the charts as the easy part. Ask how they unify ShotGrid, QuickBooks, and payroll into one model and reconcile conflicting definitions so reports stop disagreeing. If they only talk about Tableau and dashboards, they will hand you a pretty view of one silo. The right team starts with a data discovery across your source systems, builds the pipeline and model underneath, and is honest that if your data is already clean you only need charts.
- !They jump straight to charts; ask how they unify data from five disconnected tools first
- !They ignore definitions; ask how they reconcile conflicting metrics so reports stop disagreeing
- !They have no refresh plan; ask how dashboards stay current instead of a manual weekly export
- !They quote without auditing your source systems; ask for a data discovery first
- !No data-quality handling; ask how bad source data is flagged instead of silently visualized
Most Glendale teams pricing business intelligence dashboards end up comparing notes on helpdesk & ticketing, erp, custom software too; the systems share one data spine. Weighing options across the region? Nearby: business intelligence dashboards in Los Angeles, San Diego and San Jose. Prefer to talk to the team that builds these? Digital Heroes handles custom software development end to end.
The evidence behind this guide
Independent findings on why this investment pays off. Every link goes to the primary source.
- The right combination of digital transformation actions can unlock as much as US$1.25 trillion in additional market capitalization across Fortune 500 companies, while the wrong combinations put more than US$1.5 trillion at risk; companies with all three core factors (strategy, aligned technology, and change capability) saw a 5% market-value lift relative to peers. Source: Deloitte (2023) →
- In a survey of 579 supply chain professionals (July 31 to October 1, 2024), only 29% had built at least three of the five capabilities Gartner identifies as needed for future competitiveness (agility, resilience, regionalization, integrated ecosystems, and enterprise-wide strategy). Source: Gartner (2025) →
- The average developer spends more than 17 hours a week dealing with maintenance issues such as debugging and refactoring, and about four of those hours on 'bad code' - waste that equates to nearly $85 billion annually worldwide in opportunity cost. Source: Stripe (2018) →
- This analysis cites IDC research that companies lose 20-30% of revenue annually to inefficiencies caused by data silos, Gartner's estimate that poor data quality costs organizations at least $12.9 million per year on average, and a Salesforce benchmark that 80% of IT leaders say data silos hinder digital transformation - illustrating the business case for integrating systems. Source: Cherry Bekaert (citing IDC, Gartner, Salesforce, DATAVERSITY) (2024) →
Frequently asked questions
How much do custom BI dashboards cost in Glendale?
Plan for $40k to $130k. A data pipeline with a unified model and core dashboards starts near $40k to $70k over 2 to 3 months. Add margin and utilization models, automated refresh, quality checks, and custom dashboards and you reach $70k to $130k over 3 to 6 months.
We have Power BI already. Why isn't that enough?
Because Power BI visualizes data, it does not unify it. If your numbers live in ShotGrid, QuickBooks, and payroll with no shared keys, Power BI can only show one silo at a time. The missing piece is a data layer that joins them, and that is usually where the real work and value are.
Why do our reports disagree with each other?
Usually because definitions differ across source tools, what counts as revenue, a billable hour, or an active project is defined differently in each system. A custom data layer reconciles those into agreed definitions, so two reports finally produce the same number and leadership trusts both.
Can we keep using Tableau or Power BI on top?
Yes, in many cases that is the right call. The build focuses on the data layer underneath, the pipeline and unified model, and your existing BI tool sits on top of it. You get the answers you lacked without throwing away tools your team already knows.
How current will the dashboards be?
As current as the refresh you choose, typically daily or near-real-time, because the data layer pulls and updates automatically. That replaces the manual export-and-reconcile cycle that left leadership making decisions on numbers from last week.
Who owns the code when an agency builds my software?
You should, completely, through a written intellectual property assignment that transfers everything on final payment; without that clause, copyright stays with whoever wrote the code by default. Insist that the repository lives in your own GitHub organization from day one and that hosting, domains, and third-party accounts are registered to you. Also check for licenses to the agency's proprietary frameworks buried in the contract, because those can make switching vendors practically impossible even when you own your own code.
When is it time to move from Excel reports to an actual dashboard?
The reliable signal is when someone spends more than a few hours a week copying data between spreadsheets, or when two teams arrive at a meeting with different numbers for the same metric. At that point the spreadsheet is acting as an unversioned, single-person database, and a costly error is a matter of time. A first dashboard that automates those recurring reports typically pays for itself in recovered hours within the first year.
We already pay for Microsoft 365. When does building custom actually beat Power BI?
Keep Power BI for internal reporting; at $14 per user per month for Pro it is hard to beat for employee-facing analytics. Custom wins in three cases: you are showing dashboards to customers, since embedded Power BI is priced on capacity and gets expensive fast, you need a fully white-labeled experience inside your own product, or your team keeps fighting the tool to support a specific workflow. Most companies we build for keep Power BI internally even after launching a custom customer-facing dashboard.
How do I work out whether a custom dashboard will pay for itself?
Add up three numbers: hours of manual reporting it removes each month, license seats it replaces or avoids, and the value of one or two decisions it speeds up, like catching margin slippage a month earlier. Across Digital Heroes projects, internal dashboards typically pay back in 8 to 18 months, and customer-facing dashboards pay back faster when analytics is a paid feature or reduces churn. If the honest math does not clear payback within 2 years, buy an off-the-shelf tool instead.
Can we migrate years of data out of our current system into new custom software?
Almost always yes, through CSV exports or the vendor's API, and migration should be scoped as its own workstream with field mapping, a dry run, and a planned cutover window rather than an afterthought. The real time sink is rarely moving the data; it is cleaning it, since years of duplicates, free-text fields, and inconsistent formats surface all at once. Pull a full export from your current vendor before committing to anything new, because some SaaS plans restrict exports on lower tiers.
How do I calculate whether custom software will pay for itself?
Divide the build cost by the monthly benefit, where benefit is hours saved times loaded hourly cost, plus subscription fees replaced, plus any revenue the software unlocks. Three staff saving 10 hours a week each at a $40 loaded rate is about $62,000 a year, which pays back a $60,000 build in roughly 12 months. Across Digital Heroes internal-tool projects, 12 to 24 months is the normal payback range, and anything projecting under 6 months usually means the spreadsheet is hiding costs.
Can one dashboard pull from QuickBooks, Salesforce, and Google Analytics at the same time?
Yes, and combining sources like that is the main reason to build custom instead of living inside each tool's built-in reports. The standard pattern syncs each source into one warehouse using connectors such as Fivetran or Airbyte, then joins them there, so marketing spend, pipeline, and revenue finally sit in a single view. Each additional source typically adds 1 to 2 weeks to the build, mostly for field mapping and reconciliation.
Does my development team need to be located in Glendale?
No, most software projects run fully remote without any quality penalty, and what actually matters is 3 to 4 hours of working-hour overlap and a fixed weekly demo call. A team based in Glendale earns its premium in specific cases: hardware installations, warehouse or clinic floor shadowing, and discovery workshops where watching your staff work beats any written brief. Choose for senior engineers and a track record first, and treat geography as a tiebreaker.
If we move off Power BI or Tableau later, do we lose our historical data and reports?
Your raw data is safe because it lives in your source systems or warehouse, not inside Power BI or Tableau. What you lose is the logic layered on top: DAX measures, calculated fields, and report layouts all have to be rebuilt, and that rebuild is the real switching cost. Protect yourself now by keeping transformations in dbt or in warehouse views instead of inside the BI tool, so a future migration only replaces the screens.
What does it cost to keep custom software running after launch?
Budget 15-20% of the original build cost per year, which on a $100,000 system means $15,000 to $20,000 for security patches, dependency updates, bug fixes, and small improvements as real usage reveals what the spec missed. Cloud hosting for a typical business application adds $50 to $300 a month on top. Skipping maintenance does not save the money; in Digital Heroes rescue work, unmaintained systems typically need a far more expensive rebuild within about three years.
What are the most common mistakes companies make on dashboard projects?
The four we see most: designing charts before modeling the data, cramming 30 metrics onto one screen so nothing stands out, letting every team define revenue slightly differently, and skipping data quality checks so the dashboard confidently displays wrong numbers. The wrong-numbers failure is the fatal one, because a dashboard loses trust once and never fully earns it back. Spend the first weeks on metric definitions and data quality, not on colors.
Who can build custom business intelligence dashboards for a business in Glendale?
Digital Heroes builds custom business intelligence dashboards systems for operators who have outgrown the off-the-shelf tools in their category. The work is delivered remotely: our engineers work from Delhi and Lucknow, leadership is in New York, and some team members live in London and Sydney and work remotely from there. We have no office in Glendale. You can chat with the team directly, and every form gets an email reply within 24 hours.
Related guides

More from Aanya.
Senior Frontend Engineer · Next.js · Delhi · 2 posts on the site
Published · Last updated .